Future Horizons: Strategic Planning in Marketing
Analytic Tools in Marketing Strategy
We will now explore common analytic tools used to inform marketing strategy.
Strategic Planning Tools for Situation Analysis
There are three main strategic planning tools for situation analysis:
- SWOT analysis
- BCG matrix
- Ansoff matrix
SWOT Analysis
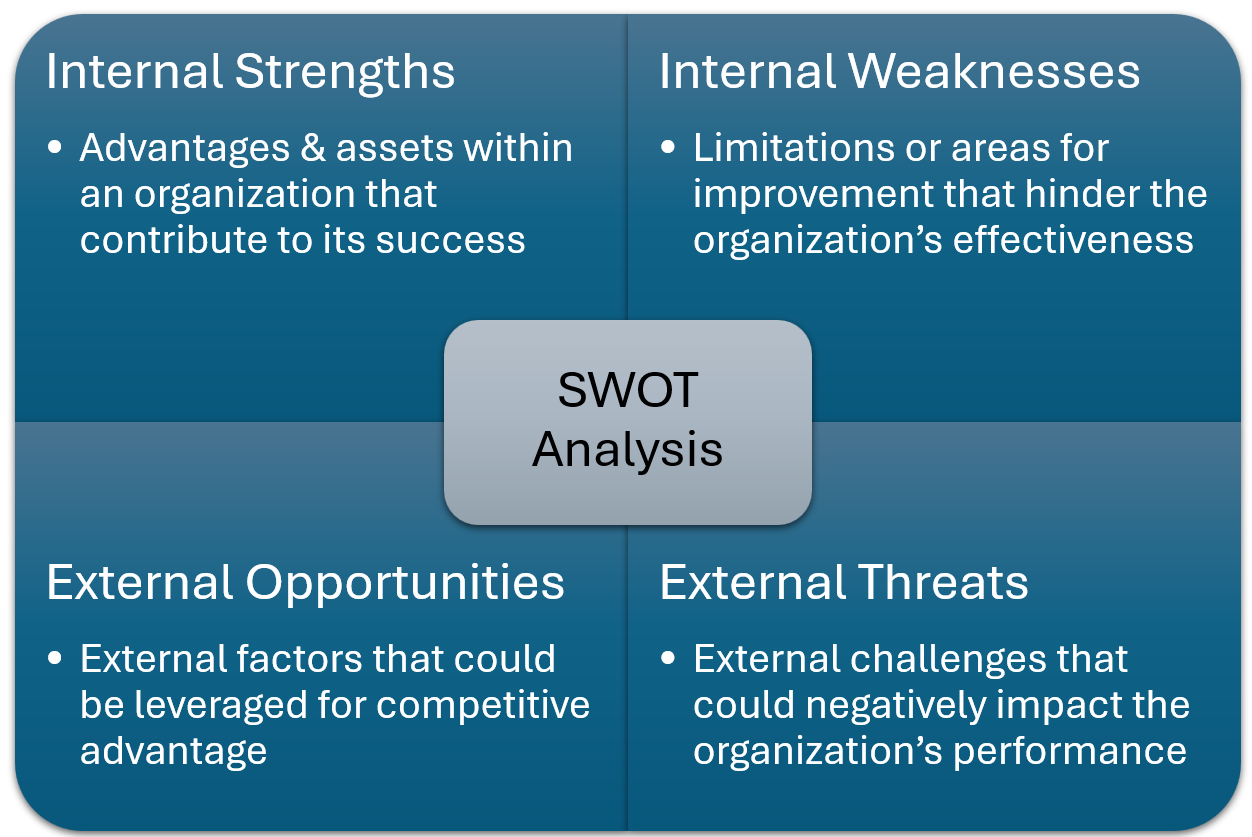
SWOT analysis[1] identifies internal strengths and weaknesses, as well as external opportunities and threats. This helps organizations assess their competitive position and prioritize strategic initiatives.
SWOT analysis can be broken down into:
- Internal Factors:
- Strengths: Competitive advantages within the organization’s control (e.g., location, reputation, and skilled staff).
- Weaknesses: Internal limitations or challenges that hinder performance (e.g., outdated facilities and limited marketing budget).
- External Factors:
- Opportunities: External factors that the organization can take advantage of (e.g., new technologies and emerging travel trends).
- Threats: External risks that could negatively impact the business (e.g., economic downturns and increased competition).

BCG Matrix
The BCG matrix[2] (or BCG growth-share matrix) is a well-known management model for analyzing a company’s product portfolio. ‘BCG’ stands for Boston Consulting Group, a well-known consultancy company that developed the BCG matrix in the 1970s. It helps organizations allocate resources, prioritize investments, and make informed decisions about product development, divestiture, or market focus.
The matrix categorizes products or business units into four quadrants based on two key factors: relative market share (x-axis) and market growth rate (y-axis).
Each quadrant represents a distinct strategic position:
- Stars:
- Characteristics: High market growth rate and high relative market share.
- Strategic Implications: These products are leaders in fast-growing markets and often require significant investment to maintain or expand their position. Over time, as market growth slows, stars may transition into cash cows.
- Cash Cows:
- Characteristics: Low market growth rate but high relative market share.
- Strategic Implications: These products generate consistent revenue with minimal investment. Businesses often use cash cows to fund other initiatives, such as developing stars or question marks.
- Question Marks:
- Characteristics: High market growth rate but low relative market share.
- Strategic Implications: These products operate in attractive markets but lack dominance. They require careful evaluation to determine whether they should receive further investment or be divested.
- Dogs:
- Characteristics: Low market growth rate and low relative market share.
- Strategic Implications: These products typically underperform and may not justify continued investment. Businesses often consider divesting or phasing out dogs unless they serve a strategic niche purpose.

Ansoff Matrix
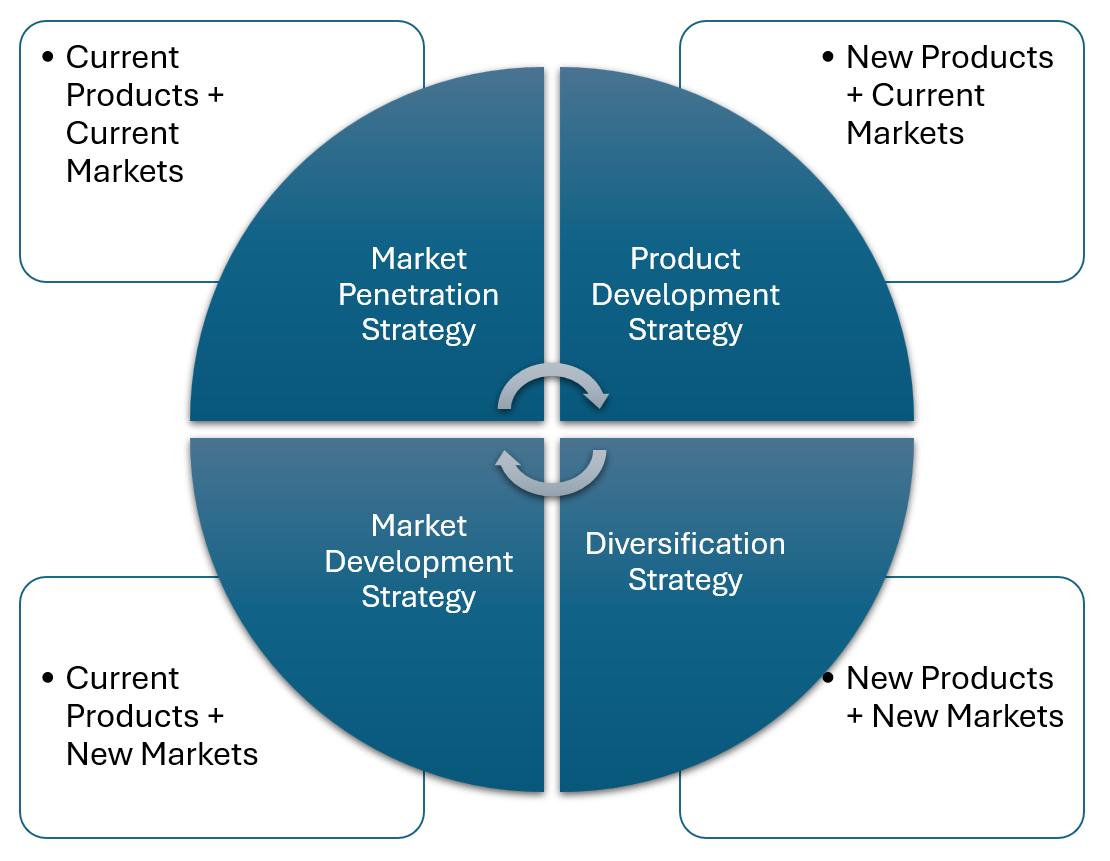
The Ansoff matrix, also known as the product/market expansion grid[3], is a strategic planning tool that helps businesses identify and evaluate growth opportunities. It was developed by Igor Ansoff in 1957.
The matrix consists of four growth strategies:
- Market Penetration: This strategy involves increasing sales of existing products in existing markets. It focuses on selling more to current customers or finding new customers within the same market.
- Market Development: This strategy involves introducing existing products to new markets. It may involve entering new geographical areas, targeting different customer segments, or finding new uses for the products.
- Product Development: This strategy involves creating and introducing new products to existing markets. Companies pursue this strategy to capitalize on their existing customer base by offering new or improved products.
- Diversification: This strategy involves entering new markets with new products. It can be either related diversification (i.e., entering a new industry related to the existing one) or unrelated diversification (i.e., entering a completely different industry).

Diversification Strategies
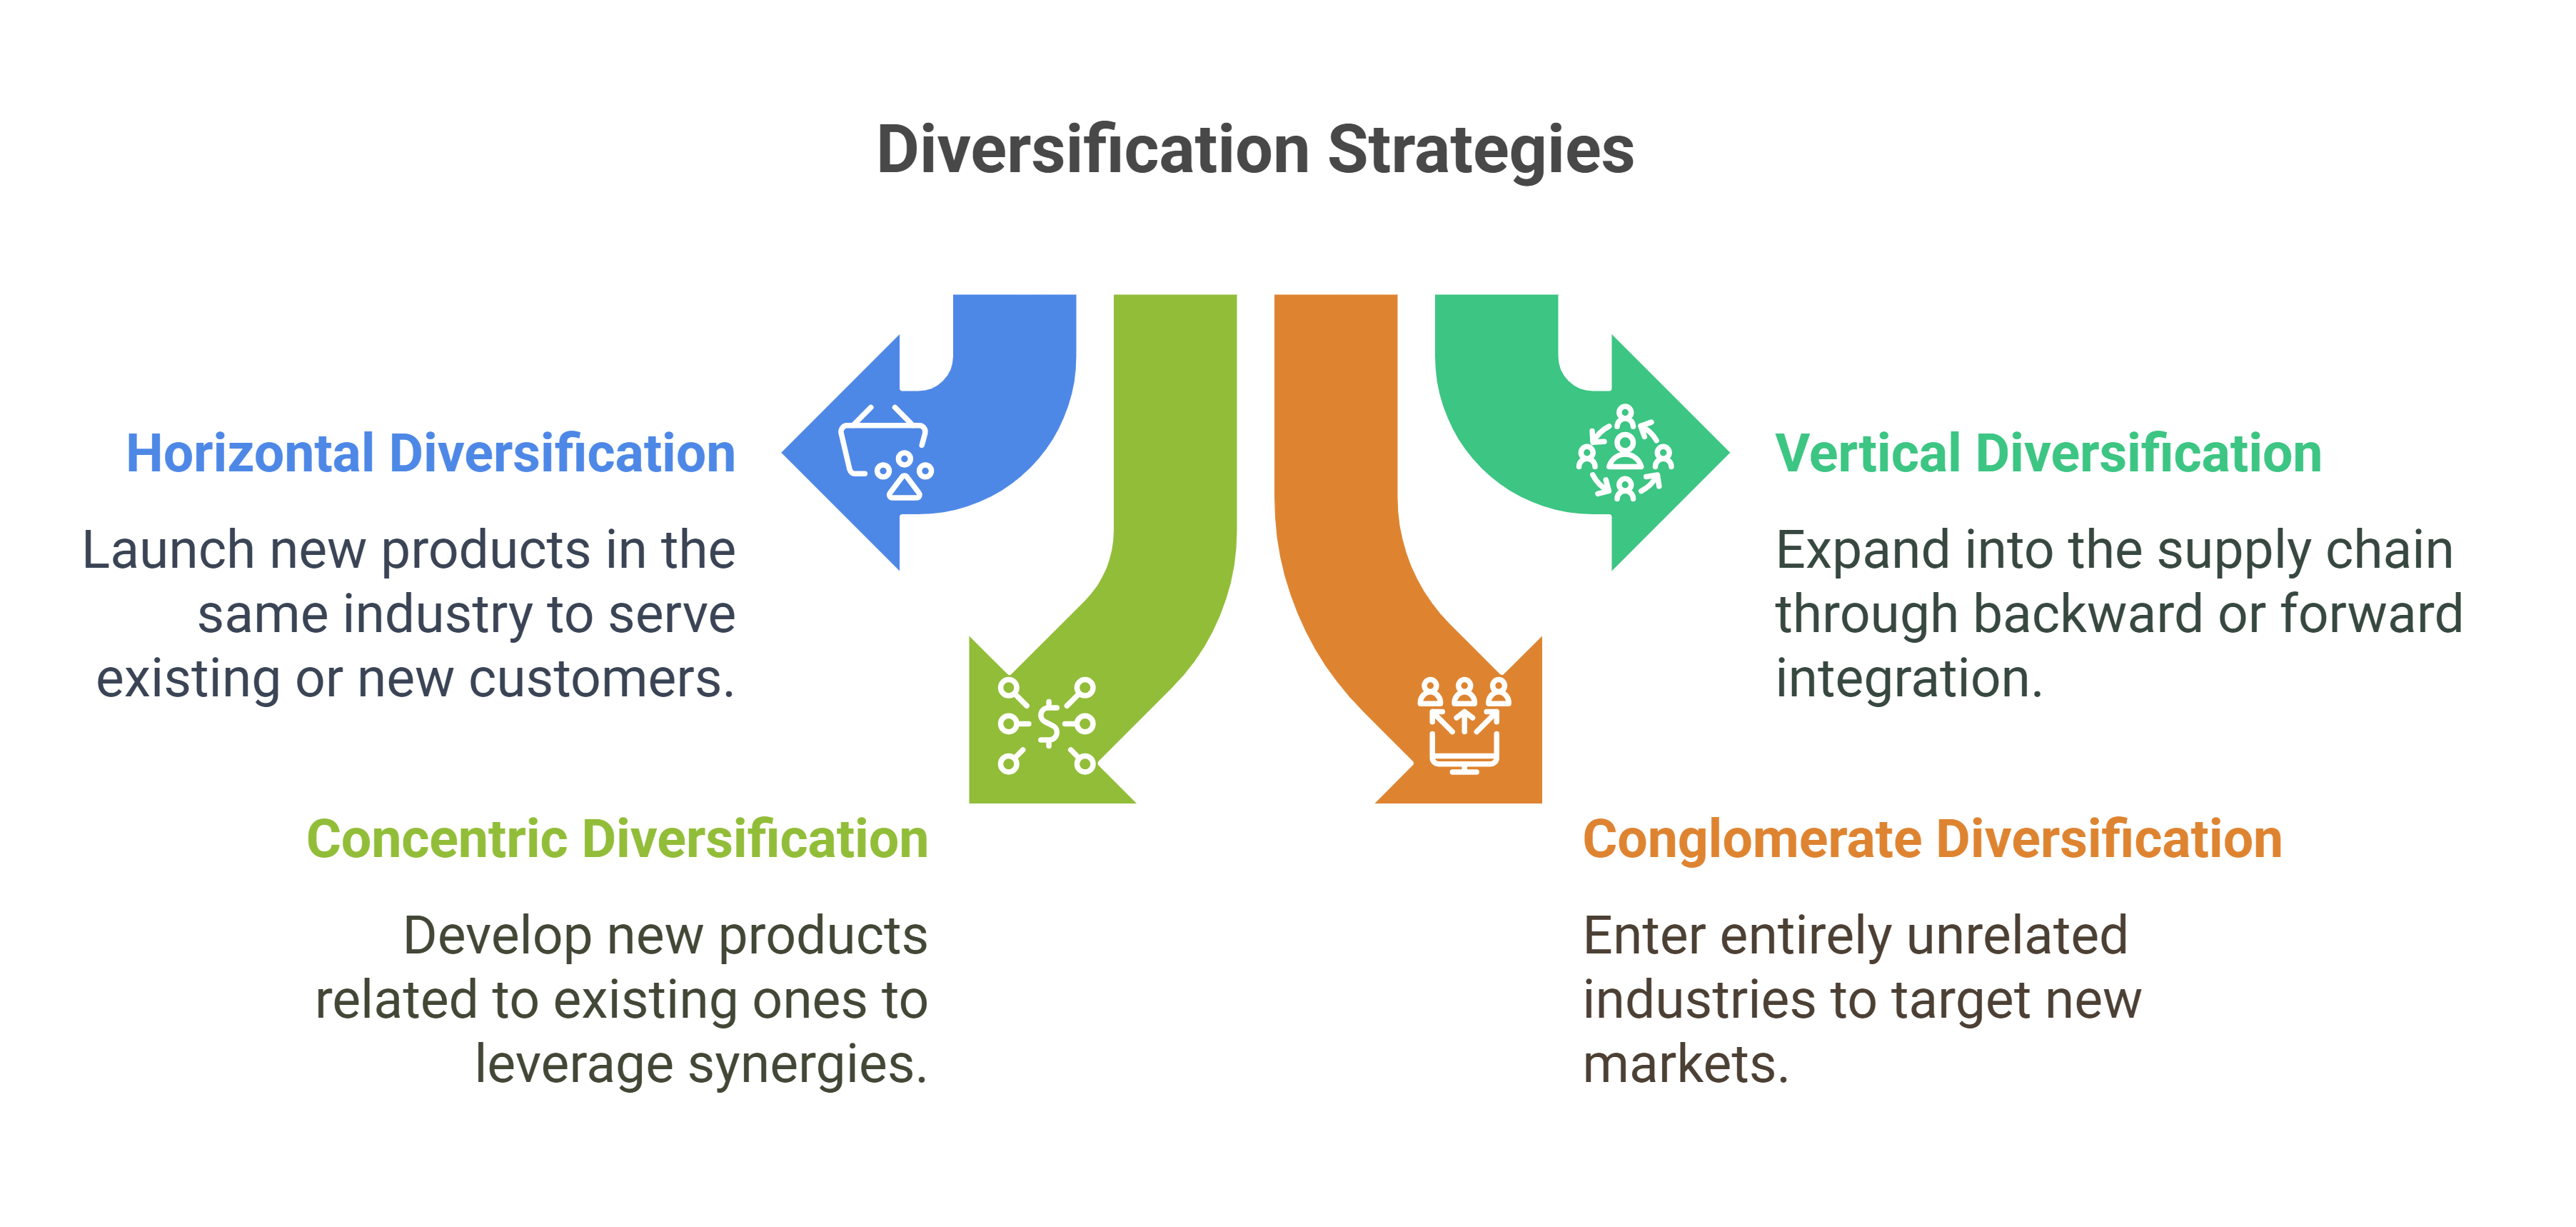
Diversification strategies are approaches companies use to expand their business operations into new markets, products, or services. Types include:
- Horizontal diversification
- Vertical diversification
- Concentric diversification
- Conglomerate diversification

Horizontal Diversification
Horizontal diversification involves expanding into new products or services that are related to the company’s existing offerings and appeal to current customers. Key aspects include:
- Leveraging existing customer relationships and brand recognition
- Utilizing similar production, distribution, or marketing capabilities
- Aiming to increase market share within the same general industry
Example
Horizontal Diversification
Hotel Chain Expansion: A hotel chain expands its brand by acquiring or developing new hotels in different geographic locations, offering similar services to broaden its market reach. This strategy allows the chain to increase its market share and leverage existing brand recognition.
Vertical Diversification
Vertical diversification, also known as vertical integration, involves expanding into different stages of the same industry’s value chain. This can be:
- Forward Integration: Moving closer to the end consumer.
- Backward Integration: Moving closer to raw materials or suppliers.
Key benefits of vertical diversification include greater control over the supply chain, potential cost reductions and improved efficiency, and enhanced quality control.
Examples
Vertical Diversification
Cruise Line Ownership of Ports: A cruise line company acquires port facilities to streamline operations and reduce costs associated with docking fees. This forward integration allows the cruise line to have greater control over its supply chain and enhance customer experience at ports.
Resort-Owned Farms: A resort establishes its own organic farm to supply fresh produce for its restaurants. This backward integration ensures quality control and reduces dependency on external suppliers.
Concentric Diversification
Concentric diversification involves expanding into a related industry that can benefit from the company’s core competencies. Key aspects include:
- Leveraging existing technologies, production processes, or marketing expertise
- Targeting new customer groups or markets
- Aiming to create synergies between new and existing business lines
Examples
Concentric Diversification
Eco-Tourism Expansion: A traditional travel agency expands into eco-tourism by offering environmentally friendly travel packages. This strategy leverages the agency’s existing expertise in travel logistics while tapping into a growing market segment focused on sustainability.
Spa Services at Hotels: A hotel chain known for business accommodations introduces wellness and spa services. These new offerings complement the existing hospitality services and attract health-conscious travelers.
Conglomerate Diversification
Conglomerate diversification involves expanding into entirely unrelated industries or markets. This strategy can lead to a more complex organizational structure as it:
- Aims to reduce overall business risk by operating in multiple, unconnected sectors
- Often requires significant resources and new expertise
Examples
Conglomerate Diversification
Hotel Group Venturing into Retail: A hotel group diversifies by opening a chain of high-end retail stores that are unrelated to its core hospitality business. This strategy spreads risk across different industries and taps into new revenue streams.
Airline Investing in Technology Startups: An airline invests in technology startups that develop travel-related apps but are not directly linked to its core operations. This move allows the airline to explore innovative solutions and diversify its investment portfolio.

Choosing a Diversification Strategy
Each diversification strategy has its own set of advantages and risks. The choice depends on various factors, including the company’s goals, resources, market conditions, and risk tolerance. Successful diversification can lead to reduced business risk, increased market power, and new growth opportunities. However, it also requires careful planning and execution to avoid overextension and loss of focus on core competencies.
Examples
Applying Strategic Planning Tools to Bob’s Diner
In this example, Bob’s Diner is a fictitious mid-sized restaurant in a small Canadian city.

SWOT Analysis
| SWOT Element | Definition | Bob’s Diner Example |
|---|---|---|
| Strengths | Internal capabilities or resources that provide a competitive advantage. |
|
| Weaknesses | Internal limitations that hinder performance or growth. |
|
| Opportunities | External factors or trends that can be leveraged for growth and innovation. |
|
| Threats | External challenges or risks that may harm performance. |
|
Strategic Recommendations for Bob’s Diner:
- Leverage Opportunities: Partner with food delivery apps to reach a broader market, especially younger customers.
- Address Weaknesses: Invest in a simple website and social media presence to attract new customers.
- Enhance Strengths: Promote signature dishes like “Bob’s Famous Meatloaf” with specials and loyalty rewards.
- Mitigate Threats: Control costs by negotiating with local suppliers and sourcing seasonal, budget-friendly ingredients.
BCG Matrix
| Quadrant | Definition | Bob’s Diner Example | Strategy |
|---|---|---|---|
| Stars | High growth, high market share. These are top performers requiring investment to maintain growth. |
|
|
| Cash Cows | Low growth, high market share. These offerings generate consistent revenue with minimal investment. |
|
|
| Question Marks | High growth, low market share. These offerings have potential but need investment to gain market traction. |
|
|
| Dogs | Low growth, low market share. These are underperformers with little future potential. |
|
|
Strategic Insights for Bob’s Diner:
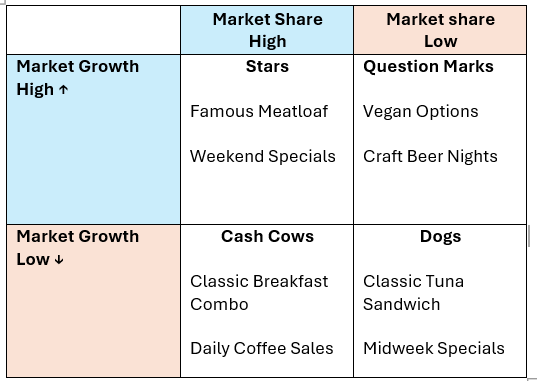
- Stars: “Bob’s Famous Meatloaf” and “Weekend Specials” should receive investment in marketing and capacity improvements to capitalize on their popularity and sustain growth.
- Cash Cows: Classic breakfast combos and coffee sales provide steady revenue. Use these profits to fund innovations like vegan options or promotions.
- Question Marks: Evaluate the performance of vegan options and craft beer nights by increasing awareness through social media and limited time offers. Monitor performance to determine if they can transition into Stars.
- Dogs: Underperforming items, such as the tuna sandwich and midweek specials, should be phased out to reduce waste and streamline the menu.

Ansoff Matrix
| Ansoff Quadrant | Definition | Bob’s Diner Example | Strategy |
|---|---|---|---|
| Market Penetration | Increasing sales of existing products in current markets. |
|
|
| Product Development | Offering new products to current markets. |
|
|
| Market Development | Expanding into new markets with existing products. |
|
|
| Diversification | Introducing new products to new markets. |
|
|
Example
Strategy in Action
If you are using a printed copy, you can scan the QR code with your digital device to go directly to the video: Moneyball | Peter Brand’s first day” [4:24 min] by NOW PLAYING

The movie Moneyball provides a powerful illustration of how a situation analysis, particularly through the lens of a SWOT (strengths, weaknesses, opportunities, and threats) framework, can reveal hidden opportunities and lead to a competitive advantage.
Strengths: The Oakland A’s identified their strength in data analysis capabilities. By employing advanced statistical methods, they were able to evaluate players more effectively than traditional scouting methods. This analytical strength allowed them to see value where others did not.
Weaknesses: The team’s primary weakness was its limited budget, which prevented them from competing for high-profile, expensive players. However, by recognizing this weakness, they were forced to innovate and find alternative strategies.
Opportunities: The A’s discovered a significant opportunity in the market inefficiency of player valuation. By focusing on undervalued statistics like on-base percentage and slugging percentage, they identified players who were overlooked by other teams. This opportunity allowed them to acquire talented players at a fraction of the cost of more traditionally valued players.
Threats: The main threat was the competition from larger market teams with substantially higher budgets. The Yankees, for example, had a payroll of over $125 million compared to the A’s $41 million. This financial disparity threatened the A’s ability to compete effectively.
Leveraging the SWOT Analysis
By conducting this thorough situation analysis, the Oakland A’s were able to:
- Identify undervalued players using advanced metrics that other teams overlooked.
- Build a competitive team despite having one of the lowest budgets in the league.
- Focus on key performance indicators like on-base percentage and slugging percentage, which were more predictive of a player’s ability to score runs.
- Compete successfully against teams with much larger budgets, achieving 95 wins on average between 2000 and 2006.
The Moneyball approach demonstrates how a well-executed situation analysis can reveal opportunities that others miss. By leveraging data analytics to identify undervalued assets (in this case, players), the Oakland A’s were able to turn their financial weakness into a strategic advantage. This strategy not only allowed them to compete effectively but also revolutionized how player value is assessed in baseball.
The success of the Moneyball strategy in baseball has implications beyond sports, showing how data-driven decision-making and innovative thinking can help organizations identify and capitalize on hidden opportunities, even when facing significant resource constraints.
Media Attributions
- Figure 1: “SWOT analysis” [created using Microsoft SmartArt] by the author is under a CC BY-NC-SA 4.0 license.
- Figure 2: “BCG matrix” [created using Microsoft SmartArt] by the author is under a CC BY-NC-SA 4.0 license.
- Figure 3: “Ansoff matrix” [created using Microsoft SmartArt] by the author is under a CC BY-NC-SA 4.0 license.
- Figure 4: “Diversification strategies” [created using Napkin.ai] by the author is under a CC BY-NC-SA 4.0 license.
- Figure 5: “Global expansion” [created using DALL-E with prompt: “produce an image representing global expansion”] by the author is under a CC BY-NC-SA 4.0 license.
- Figure 6: “Bob’s Diner” [created using DALL-E with prompts: “Create a colorful and fun image of a restaurant sign called “Bob’s Diner”. This is a fictitious restaurant in a small Canadian city.” / “Make the image more simple with fewer details” / “Make the image more homey” /”Make the image more cozy” / “Make image less rustic and with fewer details”] by the author is under a CC BY-NC-SA 4.0 license.
- Figure 7: “Bob’s BCG matrix” by the author is under a CC BY-NC-SA 4.0 license.
- Benzaghta, M. A., Elwalda, A., Mousa, M. M., Erkan, I., & Rahman, M. (2021). SWOT analysis applications: An integrative literature review. Journal of Global Business Insights, 6(1), 55–73. https://www.doi.org/10.5038/2640-6489.6.1.1148 ↵
- Madsen, D. Ø. (2017). Not dead yet: The rise, fall and persistence of the BCG matrix. Problems and Perspectives in Management, 15(1), 19–34. http://dx.doi.org/10.21511/ppm.15(1).2017.02 ↵
- Meldrum, M., & McDonald, M. (1995). The Ansoff matrix. In Key marketing concepts. Palgrave, London. https://doi.org/10.1007/978-1-349-13877-7_24 ↵
- UW Online Collaboratives. (2016, August 24). The story of Moneyball proves importance of both big data and big ideas. https://uwex.wisconsin.edu/stories-news/moneyball-proves-importance-big-data-big-ideas/ ↵
- Rao, S. (2020). Moneyball: Using data as a game-changer. LinkedIn. https://www.linkedin.com/pulse/moneyball-using-data-game-changer-samhita-rao/ ↵
- NOW PLAYING. (2022, March 5). Moneyball | Peter Brand's first day [Video]. YouTube. https://youtu.be/unGSY5l76YQ?si=SD4sT6nx4jeb-O8H ↵
A framework for assessing an organization’s Strengths, Weaknesses, Opportunities, and Threats to inform strategic decision-making.
A framework created by Boston Consulting Group to evaluate the strategic position of a business brand portfolio and its potential. It classifies business units or products into four categories based on market growth and market share: Stars, Cash Cows, Question Marks, and Dogs.
A strategic framework for identifying growth opportunities by categorizing strategies into market penetration, market development, product development, and diversification.
A growth strategy focused on selling existing products to existing markets, often through increased marketing efforts or competitive pricing.
A growth strategy that involves selling existing products to new markets or customer segments.
A growth strategy that involves creating new products or services for existing markets.
A growth strategy involving entering new markets with new products or services.

