Crafting the Offer: Products
New Product Development
New product development[1] (NPD) is a deliberate process an organization uses to transform an idea for a new product into a product that is ready to be sold in the marketplace.
This process is important for organizations for several key reasons:
- Meeting Changing Needs: New product development helps organizations address changes in customer preferences and market demands, ensuring their offerings remain relevant.
- Staying Competitive: By introducing new products, companies can stand out from competitors and attract new customers.
- Driving Growth: Launching new products creates opportunities for increased sales and revenue, supporting the organization’s long-term success.
- Adapting to Trends: It enables organizations to take advantage of new technologies, materials, or cultural shifts, keeping them aligned with current market trends.
Stages of NPD
Many models have been developed to explain the NPD process. The key activities or stages involved in the NPD process are as follows:
- Idea Generation: This initial stage involves brainstorming and gathering ideas for new products. Ideas can be sourced from market research, customer feedback, emerging trends, and internal brainstorming sessions. The goal is to generate a pool of ideas that have the potential to meet consumer needs and provide value in the market.
- Idea Evaluation: Once a list of potential ideas is generated, they must be evaluated for feasibility, profitability, and market potential. This involves assessing factors such as production costs, market demand, competition, and potential risks. Only the most promising ideas move forward to the development stage.
- Concept Development and Testing: In this stage, the selected ideas are developed into detailed product concepts. These concepts are then tested with target consumers to gather feedback and validate the product’s appeal and functionality. This helps refine the product concept and ensure it aligns with consumer expectations.
- Business Analysis: A thorough business analysis is conducted to assess the financial viability of the new product. This includes estimating costs, revenues, and profitability, as well as evaluating the product’s impact on the company’s overall business strategy.
- Product Development: The product is developed into a prototype or a working model. This stage involves designing, engineering, and testing the product to ensure it meets quality standards and functions as intended. Iterative testing and refinement are crucial to address any issues before full-scale production.
- Market Testing: Before a full-scale launch, the product is introduced to a limited market to test its performance and gather additional consumer feedback. This stage helps identify any last-minute adjustments needed to optimize the product and marketing strategy.
- Commercialization: The final stage involves launching the product to the broader market. This includes developing a go-to-market strategy, which encompasses marketing, distribution, and sales plans. Effective marketing and promotion are essential to drive initial sales.
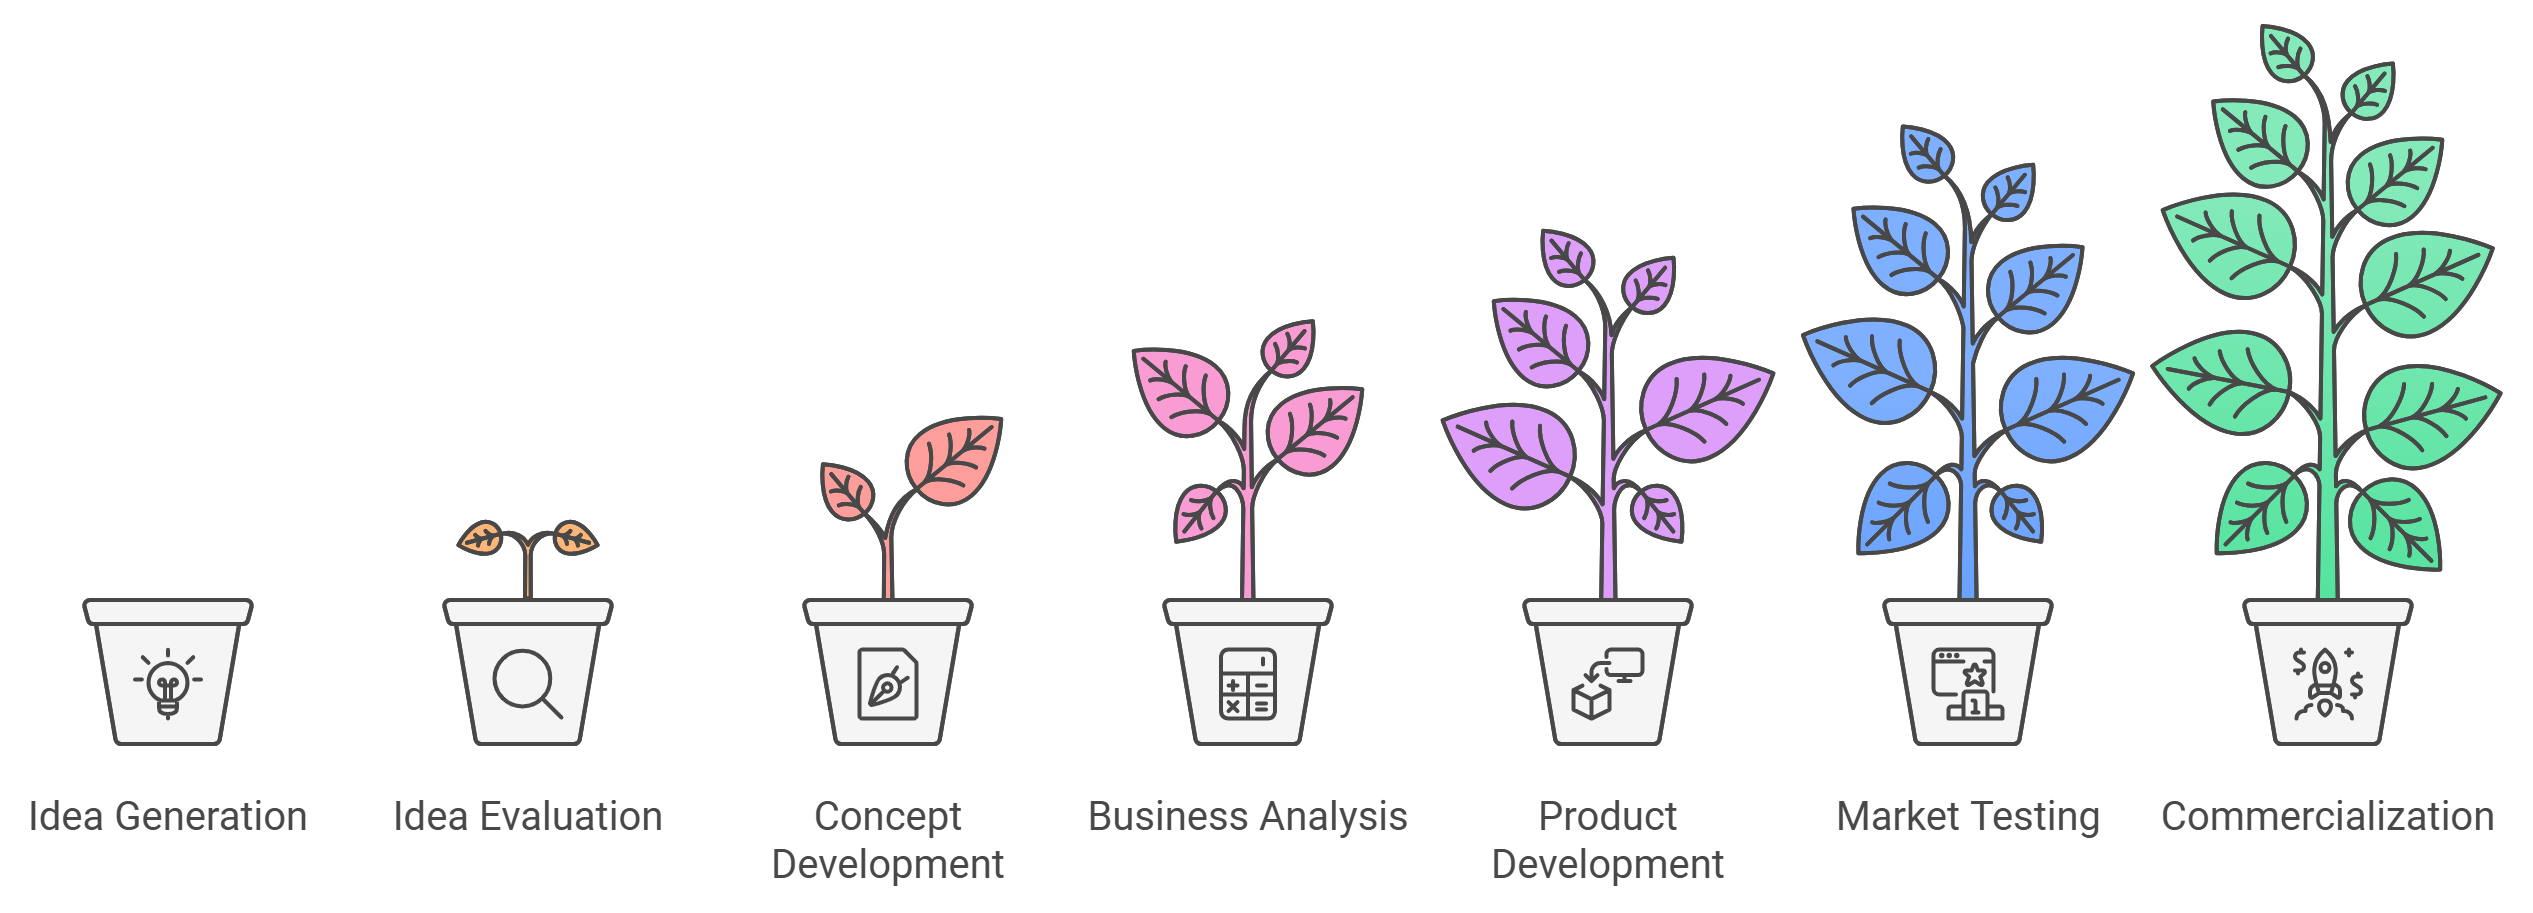
Figure 1 Stages of new product development (by author using Napkin.ai) CC BY-NC-SA 4.0
Recent Models and Frameworks to Support NPD
In recent years, several models and frameworks have emerged to support new product development.
Lean Startup Methodology[2]
Lean startup methodology focuses on developing a minimum viable product (MVP) to quickly test and validate ideas in the market, minimizing waste and optimizing resources.
By launching a basic version of a product, companies can gather customer feedback and iterate rapidly, ensuring the final product aligns with market needs.
Design Thinking[3][4]
Design thinking is a human-centered approach that emphasizes empathy, ideation, and experimentation. It involves understanding user needs, defining problems, brainstorming solutions, prototyping, and testing.
This framework helps teams create innovative solutions that are both user-friendly and technically feasible, enhancing the overall product development process.
Business Model Canvas[5]
The business model canvas is a strategic tool that outlines a company’s value proposition, infrastructure, customers, and finances. It helps visualize and develop new business models.
By mapping out key components of a business model, companies can identify opportunities and challenges, ensuring alignment with product development efforts.
Digital and AI-Driven Innovation[6]
The integration of digital technologies and artificial intelligence (AI) in product development is becoming increasingly prevalent. AI can enhance data analysis, automate processes, and improve decision-making.
Companies use AI to gather insights, optimize designs, and personalize products, leading to more efficient and innovative product development.

Stages of New Product Adoption
Consumers are continually exposed to new products. The new product adoption process describes the stages that consumers go through when they first encounter and eventually adopt a new product.
The process is typically divided into five stages:
- Awareness: At this stage, the consumer becomes aware of the new product but lacks detailed information about it.
- Interest: Once aware, the consumer shows interest in the product and begins to seek out more information.
- Evaluation: During the evaluation stage, consumers consider whether the product meets their needs and assess its value compared to alternatives. They may seek reviews, testimonials, and comparisons to help them make informed decisions.
- Trial: Consumers decide to try the product, often through free trials, demos, or initial purchases.
- Adoption/Rejection: After the trial, consumers decide whether to adopt the product as a regular part of their lives or reject it. Successful adoption occurs when consumers are convinced of the product’s value and integrate it into their routines.
This process is not always linear. Consumers may move back and forth between stages.

In addition, the adoption process is influenced by several factors, including:
- Perceived Usefulness: The extent to which the product is seen as beneficial in solving a problem or fulfilling a need.
- Ease of Use: How easy it is for consumers to understand and use the product.
- Social Influence: Recommendations and opinions from peers, influencers, and experts.
- Trialability: The ability to test the product before committing to a purchase.
- Compatibility: How well the product fits with existing habits, values, and needs.
Example
Recreation Product Adoption: A Non-Linear Journey
Consider a new mountain biking trail navigation app as an example of how product adoption can be a dynamic, non-linear process.
Scenario: The Mountain Biker’s Adoption Journey
Sarah, an avid mountain biker, encounters the trail navigation app through different stages that do not follow a strict linear progression:
- Initial Awareness and Interest: Sarah first learns about the app through a social media post from a mountain biking influencer. This triggers her initial interest, but she does not immediately download the app.
- Evaluation and Hesitation: During a local mountain biking club meetup, Sarah hears mixed reviews about the app. Some members praise its features, while others mention technical complexities. This creates a back-and-forth in her adoption process.
- Trialability and Compatibility: The app offers a free 7-day trial, which addresses her concerns about trialability. However, Sarah initially finds the interface somewhat complex, which challenges the ease-of-use factor.
- Social Influence and Re-Evaluation: After watching tutorial videos and getting recommendations from her most trusted cycling friend, Sarah decides to give the app another chance. This demonstrates how social influence can re-engage potential adopters.
- Activation and Ongoing Adoption: During a weekend mountain biking trip, Sarah discovers the app’s unique features that solve her navigation challenges. She experiences the “aha moment” of product value, moving from hesitation to active adoption.
Key Adoption Factors in This Scenario
| Factor | Impact on Adoption |
|---|---|
| Perceived Usefulness | High — Solves trail navigation challenges |
| Ease of Use | Initially low, improved with learning |
| Social Influence | Significant — Club members and influencer recommendations |
| Trialability | Positive — Free trial reduced commitment risk |
| Compatibility | Moderate — Fits mountain biking lifestyle |
Insights for Recreation Product Developers
The scenario illustrates that product adoption is rarely a straight path. Consumers like Sarah may:
- Move between adoption stages
- Require multiple touchpoints
- Need social validation
- Seek ease of use and clear value proposition
By understanding these nuanced adoption dynamics, recreation and tourism product developers can create more engaging and user-centric experiences
Product Adoption Curve
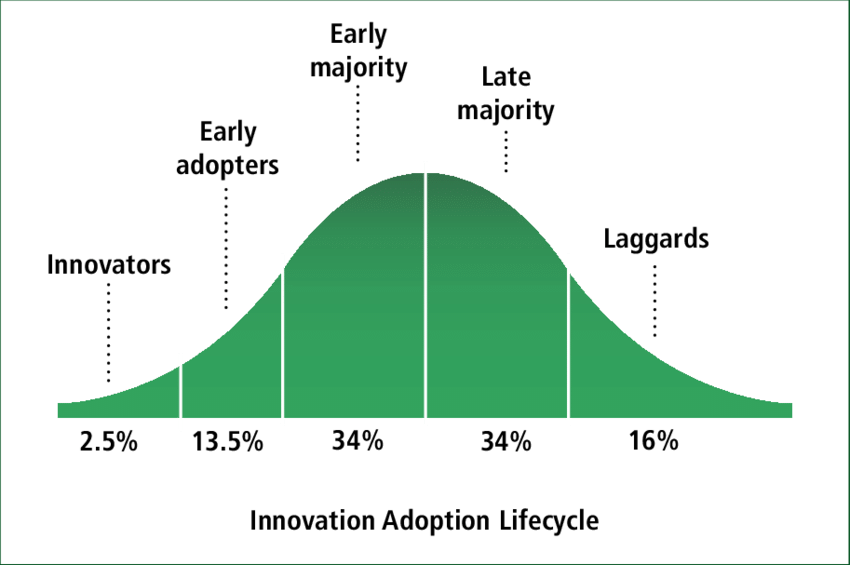
The speed of the adoption process is also dependent on the type of consumer. The product adoption curve, also known as the innovation adoption curve, is a model that describes how different segments of the population adopt new products or technologies over time. This model was first introduced by Everett M. Rogers in his book “Diffusion of Innovations.”[7]
The curve is often depicted as a bell-shaped graph and is divided into five distinct adopter categories:
- Innovators: Innovators are the first to adopt new products. They are risk-takers, tech enthusiasts, and are often driven by a passion for innovation. This group represents about 2.5% of the market. Innovators help create buzz and provide early feedback, which is crucial for refining the product.
- Early Adopters: Early adopters are opinion leaders and influencers who embrace new technologies and ideas quickly. They are more concerned about their reputation as being ahead of the curve and represent about 13.5% of the market. Early adopters help spread the word about the product and validate its value proposition to the broader market.
- Early Majority: The early majority are pragmatic consumers who adopt new products once they have been proven and are widely accepted. They represent about 34% of the market. This group is critical for achieving mass market penetration, as they provide the volume needed for mainstream success.
- Late Majority: The late majority are skeptical and cautious consumers who adopt new products only after the majority of the market has accepted them. They also represent about 34% of the market. Their adoption is often driven by necessity or social pressure, and they require assurance of the product’s reliability and value.
- Laggards: Laggards are the last to adopt new products. They are typically resistant to change and prefer traditional methods. This group represents about 16% of the market. Laggards adopt products only when they become the standard or when they have no other choice.
Importance of the Product Adoption Curve
Understanding the product adoption curve helps marketers tailor strategies to target each segment effectively. For example, marketing efforts for innovators and early adopters might focus on highlighting cutting-edge features and exclusivity, while strategies for the early and late majority might emphasize reliability and social proof. By aligning marketing and product development strategies with the adoption curve, companies can optimize product launches and drive successful adoption across all consumer segments.
Example
Adventure Tourism

Innovators (2.5%):
- Extreme sports enthusiasts seeking untested experiences
- First to try new adventure destinations or activities
- Marketing Focus: Emphasize novelty and exclusivity of cutting-edge adventures.
Early Adopters (13.5%):
- Adventure bloggers and social media influencers
- Seek unique experiences to share with followers
- Marketing Focus: Offer exclusive previews and behind-the-scenes access.
Early Majority (34%):
- Experienced travelers looking for new but proven adventures
- Influenced by positive reviews and recommendations
- Marketing Focus: Highlight safety features and testimonials from early adopters.
Late Majority (34%):
- More cautious travelers interested in popular adventure activities
- Prefer established destinations and well-reviewed experiences
- Marketing Focus: Emphasize widespread popularity and value for money.
Laggards (16%):
- Traditional tourists who eventually try adventure activities
- Motivated by FOMO (Fear of Missing Out) or family pressure
- Marketing Focus: Stress ease of participation and family-friendly aspects.
Example
Fitness Technology

Innovators:
- Tech-savvy fitness enthusiasts
- First to adopt new wearable devices or virtual reality fitness experiences
- Marketing Focus: Highlight cutting-edge features and integration with other technologies.
Early Adopters:
- Fitness influencers and personal trainers
- Quick to incorporate new tech into their routines and client recommendations
- Marketing Focus: Offer exclusive trials and partnership opportunities.
Early Majority:
- Regular gym-goers looking to enhance their workouts
- Influenced by positive reviews and visible results
- Marketing Focus: Emphasize proven benefits and user-friendly interfaces.
Late Majority:
- Casual exercisers who adopt fitness tech after it becomes mainstream
- Motivated by peer pressure or health concerns
- Marketing Focus: Stress ease of use and compatibility with popular fitness apps.
Laggards:
- Traditional exercisers who prefer low-tech methods
- Eventually adopt basic fitness tracking features
- Marketing Focus: Highlight simplicity and long-term health benefits.
Stages of Life: The Product Life Cycle
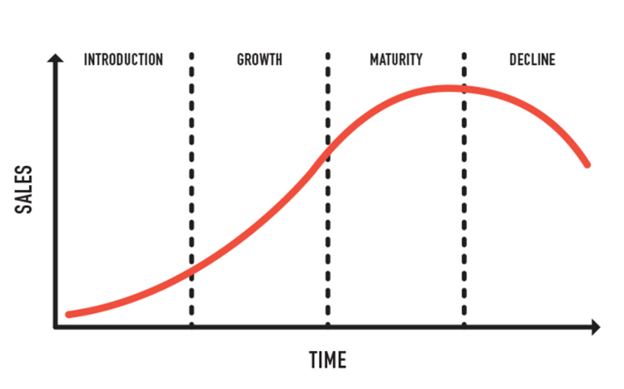
The product life cycle (PLC) is a concept in marketing that outlines the stages a product goes through, from its introduction to its eventual withdrawal from the market. Understanding these stages helps businesses make informed decisions about marketing strategies, pricing, and product management.
The product life cycle typically consists of four main stages:
- Introduction
- Growth
- Maturity
- Decline
1. Introduction
The introduction stage is when a product is launched. Marketing efforts are high to build awareness and encourage trial. Sales grow slowly, and costs are high due to initial marketing and distribution expenses.
Example
Introduction Stage (1-3 years)
Virtual Reality (VR) Travel Experiences[8][9]
Timeline: 2022 to 2024
- Major travel companies and tech firms introduced immersive VR travel experiences.
- Marketing efforts focused on educating consumers about the benefits of virtual exploration.
- High initial costs due to investments in VR technology and content creation.
- Early adopters, typically tech-savvy travelers and those with limited mobility, were the primary target market.
2. Growth
The growth stage is when the product gains acceptance, sales increase rapidly, and profitability begins to rise. Companies may enhance product features and expand distribution to capture more market share. Competition often starts to increase during this phase.
Example
Growth Stage (3-5 years)
Sustainable Luxury Eco-Resorts[10][11]
Timeline: 2020 to 2024
- Luxury hotel chains expanded their eco-friendly resort offerings to capture the growing sustainable travel market.
- Sales increased as the concept gained popularity among environmentally conscious travelers and those seeking unique experiences.
- Marketing emphasized sustainability credentials and immersive nature experiences.
- Resorts began differentiating themselves through innovative eco-technologies and conservation programs.
3. Maturity
The maturity stage is when sales growth slows as the product reaches peak market penetration. The market becomes saturated, and competition is intense. Businesses focus on differentiating their product and retaining market share, often through pricing strategies and product improvements.
Example
Maturity Stage (5-10 years)
Airbnb and Short-Term Rentals[12][13]
Timeline: 2015 to 2024
- Growth rates have slowed compared to the rapid expansion of the early 2010s.
- Intense competition among various short-term rental platforms and traditional accommodation providers.
- Focus on product differentiation through unique experiences, loyalty programs, and business travel offerings.
- Pricing strategies to maintain market share, such as dynamic pricing and long-term stay discounts.
- Efforts to expand into new markets and services (e.g., experiences, luxury rentals) to sustain growth.
4. Decline
The decline stage is when sales and profits begin to fall as the product loses consumer interest, often due to market saturation or the introduction of superior alternatives. Companies may reduce marketing efforts and eventually phase out the product.
Example
Decline Stage (variable, can be 5 years)
Traditional Travel Agencies[14][15][16]
Timeline: Late 1990s to present
- Decreasing sales and profitability as consumers shifted to online booking.
- Reduced marketing expenditure for traditional agency services.
- Consolidation in the industry, with many agencies closing or merging.
- Adaptation strategies, such as focusing on niche markets or high-end, personalized travel planning services.
Applications in Tourism
The product life cycle has been adapted and applied to tourism using the following models.
The Tourist Area Life Cycle Model
Richard W. Butler adapted the product life cycle (PLC) model to tourism by developing the tourism area life cycle (TALC) model[17]. This model outlines the stages of development and change that tourist destinations undergo over time. Here is an overview of Butler’s adaptation:
Stages of the TALC
- Exploration: A small number of tourists visit the destination, attracted by its natural or cultural features. There is minimal impact on the local environment and community, and tourism has little economic significance.
- Involvement: Local residents begin to provide services and facilities for tourists, such as guesthouses and restaurants. The destination starts to gain recognition, and the tourism season may develop.
- Development: The destination experiences a rapid increase in tourist numbers, often exceeding the local population during peak periods. Infrastructure and facilities expand, often with investment from external organizations. The local community may begin to experience changes they do not approve of.
- Consolidation: Tourism growth slows, but the destination remains popular. The local economy becomes heavily dependent on tourism, and major franchises may establish a presence. Some local opposition to tourism may arise.
- Stagnation: Visitor numbers peak, and the destination’s carrying capacity may be exceeded, leading to environmental, social, and economic issues. The destination may lose its original appeal and become less fashionable.
- Post-Stagnation (Rejuvenation or Decline): After stagnation, several scenarios are possible:
- Rejuvenation: Successful redevelopment or new attractions lead to renewed growth.
- Stabilization: Modifications stabilize tourism without significant growth.
- Decline: Continued overuse or lack of investment leads to a decrease in tourist numbers, potentially resulting in the destination exiting the tourism market.
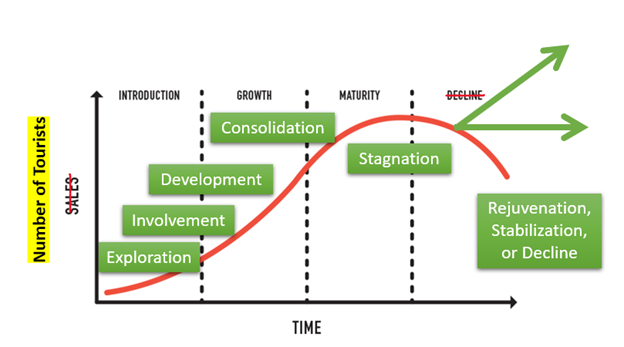
Butler’s TALC model has been influential in tourism studies, providing a framework for understanding the lifecycle of tourist destinations and guiding strategic planning for sustainable tourism development.
Plog’s Tourist Typology
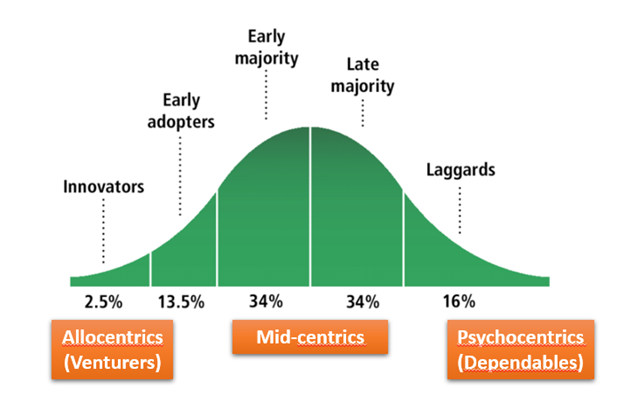
As we learned in Chapter 3, when examining segmentation approaches, Stanley Plog developed a typology that classifies (segments) tourists along a spectrum from psychocentric (or dependable) to allocentric (or venturer)[18][19]:
- Psychocentrics (Dependables): Prefer familiar destinations, packaged tours, and tourist-oriented facilities. They are less adventurous and seek safety and structure in their travels.
- Allocentrics (Venturers): Seek new experiences, are adventurous, confident, and prefer non-touristy destinations. They enjoy immersing themselves in local cultures.
- Mid-centrics: The largest group, falling in the middle of the spectrum. They have characteristics of both psychocentrics and allocentrics.
Similarities to Rogers’ Model
Like Rogers’ adoption curve, Plog’s model follows a bell-shaped distribution:
- Psychocentrics and Allocentrics each represent about 2.5-4% of the population
- Near-psychocentrics and Near-allocentrics each represent about 16%
- Mid-centrics represent the majority at about 62-64%
This distribution is similar to Rogers’ innovators, early adopters, early/late majority, and laggards.
Application to Destination Lifecycle
Plog theorized that destinations evolve over time, attracting different types of tourists as they develop:
- New, undiscovered destinations attract allocentrics
- As word spreads, near-allocentrics and mid-centrics visit
- Mass tourism develops, attracting near-psychocentrics
- Finally, mostly psychocentrics visit as the destination becomes commercialized
This lifecycle concept aligns with the product lifecycle and Butler’s Tourism Area Life Cycle model.
Criticism
While widely taught, Plog’s model has faced some criticisms:
- It may oversimplify tourist motivations and behaviours.
- Actual travel patterns do not always match predicted psychographic profiles.
- The model assumes destinations inevitably progress through stages.
Despite these limitations, Plog’s model remains influential in tourism research and marketing for understanding different tourist segments and destination development patterns.
Why Are These Theories Important for Tourism?
Collectively, Plog’s, Rogers’, and Butler’s theories provide a comprehensive framework for understanding how destinations evolve, how different types of tourists engage with them, and how new ideas in tourism spread through populations. Their interconnected concepts offer valuable insights for tourism marketing, destination management, and predicting future trends in tourism.
Media Attributions
- Figure 1: “Stages of new product development” [created using Napkin.ai] by the author is under a CC BY-NC-SA 4.0 license.
- Figure 2: “Initiative Idea Bulb” [AI-generated image] by TungArt7 (2024), via Pixabay, is used under the Pixabay content license.
- Figure 3: “Stages of new product adoption” [created using Napkin.ai] by the author is under a CC BY-NC-SA 4.0 license.
- Figure 4: “Innovation Adoption Lifecycle – Technology Adoption Life Cycle” by NicePNG.com is used non-commercially under the NicePNG.com Copyright Policy & Terms of Service.
- Figure 5: “People Hiking on Mountain” by Guduru Ajay bhargav (2018), via Pexels, is used under the Pexels license.
- Figure 6: “A Man in White Jacket” by RDNE Stock project (2021), via Pexels, is used under the Pexels license.
- Figure 7: “Product Life Cycle Management” by Tres West (2022), via Wikimedia Commons, is used under a CC BY-SA 4.0 license.
- Figure 8: “The tourist area life cycle model” [Adapted from “Product Life Cycle Management” (Tres West, 2022, Wikimedia Commons)] was adapted by the author under a CC BY-SA 4.0 license.
- Figure 9: “Plog’s tourist typology” [Adapted from “Innovation Adoption Lifecycle – Technology Adoption Life Cycle” (NicePNG.com)] was adapted by the author under the NicePNG.com Copyright Policy & Terms of Service.
- Iqbal, M., & Suzianti, A. (2021). New product development process design for small and medium enterprises: A systematic literature review from the perspective of open innovation. Journal of Open Innovation: Technology, Market, and Complexity, 7(2), Article 153. https://doi.org/10.3390/joitmc7020153 ↵
- Cassens, N. (2021). The lean startup: A systematic literature review [Seminar paper, Fachhochschule Wedel University of Applied Sciences]. Seminar IT-Management in the Digital Age (Winter 2021). https://www.fh-wedel.de/fileadmin/Mitarbeiter/Records/Cassens_2021_-_The_Lean_Startup_-_A_Systematic_Literature_Review.pdf ↵
- Brown, T. (2009). Change by design: How design thinking transforms organizations and inspires innovation. Harper Business. ↵
- Beckman, S. L., & Barry, M. (2007). Innovation as a learning process: Embedding design thinking. California Management Review, 50(1), 25–56. https://doi.org/10.2307/41166415 ↵
- Osterwalder, A., & Pigneur, Y. (2010). Business model generation: A handbook for visionaries, game changers, and challengers. John Wiley & Sons. ↵
- Füller, J., Hutter, K., Wahl, J., Bilgram, V., & Tekic, Z. (2022). How AI revolutionizes innovation management – Perceptions and implementation preferences of AI-based innovators. Technological Forecasting and Social Change, 174, Article 121598. https://doi.org/10.1016/j.techfore.2022.121598 ↵
- Rogers, E. M. (2003). Diffusion of innovations (5th ed.). The Free Press. ↵
- Team EMB. (2024, April 1). How VR tourism is revolutionizing travel experiences. EMB Global. https://blog.emb.global/vr-tourism-is-revolutionizing-travel-experiences/ ↵
- Tamer, T. (2024, September 17). Real examples and use cases of metaverse in tourism. Capsule Sight. https://capsulesight.com/metaverse/real-examples-and-use-cases-of-metaverse-in-tourism/ ↵
- Admin. (2024, October 23). The future of eco-luxury: Trends redefining sustainable travel. Tentickle. https://www.tentickle-luxurytents.com/the-future-of-eco-luxury-trends-redefining-sustainable-travel/ ↵
- Lindberg, R. (2023, August 8). Green sophistication: The rise of luxury eco-resorts and sustainable glamping. One Planet Journey. https://oneplanetjourney.com/green-sophistication-rise-luxury-eco-resorts-sustainable-glamping/ ↵
- Milinkovic, Z. (2024, April 25). Airbnb demand in 2024: Finding profitable markets. iGMS. https://www.igms.com/airbnb-demand/ ↵
- Stevens, R. (2024, June 24). Is Airbnb dead in 2024? New Silver. https://newsilver.com/the-lender/is-airbnb-dead/ ↵
- Braga, M. (2016, March 18). Why are travel agents still a thing? VICE Media. https://www.vice.com/en/article/why-are-travel-agents-still-a-thing-internet-airlines-agencies/ ↵
- TravelPerk. (2022, September 14). Are travel agencies going out of business? https://www.travelperk.com/blog/are-travel-agencies-are-going-out-of-business/ ↵
- Fernandez-Arias, E. (2023, January 5). How online booking has changed the travel agent landscape. TravelPerk. https://www.travelperk.com/blog/how-online-booking-has-changed-travel-agent-landscape/ ↵
- Butler, R. W. (1980). The concept of a tourist area cycle of evolution: Implications for management of resources. Canadian Geographies / Géographies canadiennes, 24(1), 5–12. https://doi.org/10.1111/j.1541-0064.1980.tb00970.x ↵
- Plog, S. C. (1974). Why destination areas rise and fall in popularity. Cornell Hotel and Restaurant Administration Quarterly, 14(4), 55–58. https://doi.org/10.1177/001088047401400409 ↵
- Plog, S. (2001). Why destination areas rise and fall in popularity: An update of a Cornell quarterly classic. Cornell Hotel and Restaurant Administration Quarterly, 42(3), 13–24. https://journals.sagepub.com/doi/abs/10.1177/0010880401423001 ↵
A model showing how different consumer groups adopt new products over time.
Classifications of consumers based on when they adopt new products, including innovators, early adopters, early majority, late majority, and laggards.

