Crafting the Offer: Products
Service and Experience Products
Service and experience products are distinct categories within the broader spectrum of consumer offerings, each with unique characteristics and implications for businesses and consumers.
Service Definition
A service can be defined as follows:
- “A service is a time-perishable, intangible experience performed for a customer acting in the role of a co-producer.”[1]
- “Services are deeds, processes, and performances.”[2]
Examples
Services
Service examples include:
- Professional services, such as consulting or legal advice
- Personal services, such as hairdressing or spa treatments
- Hospitality services, such as hotel accommodation and dining
Service Characteristics
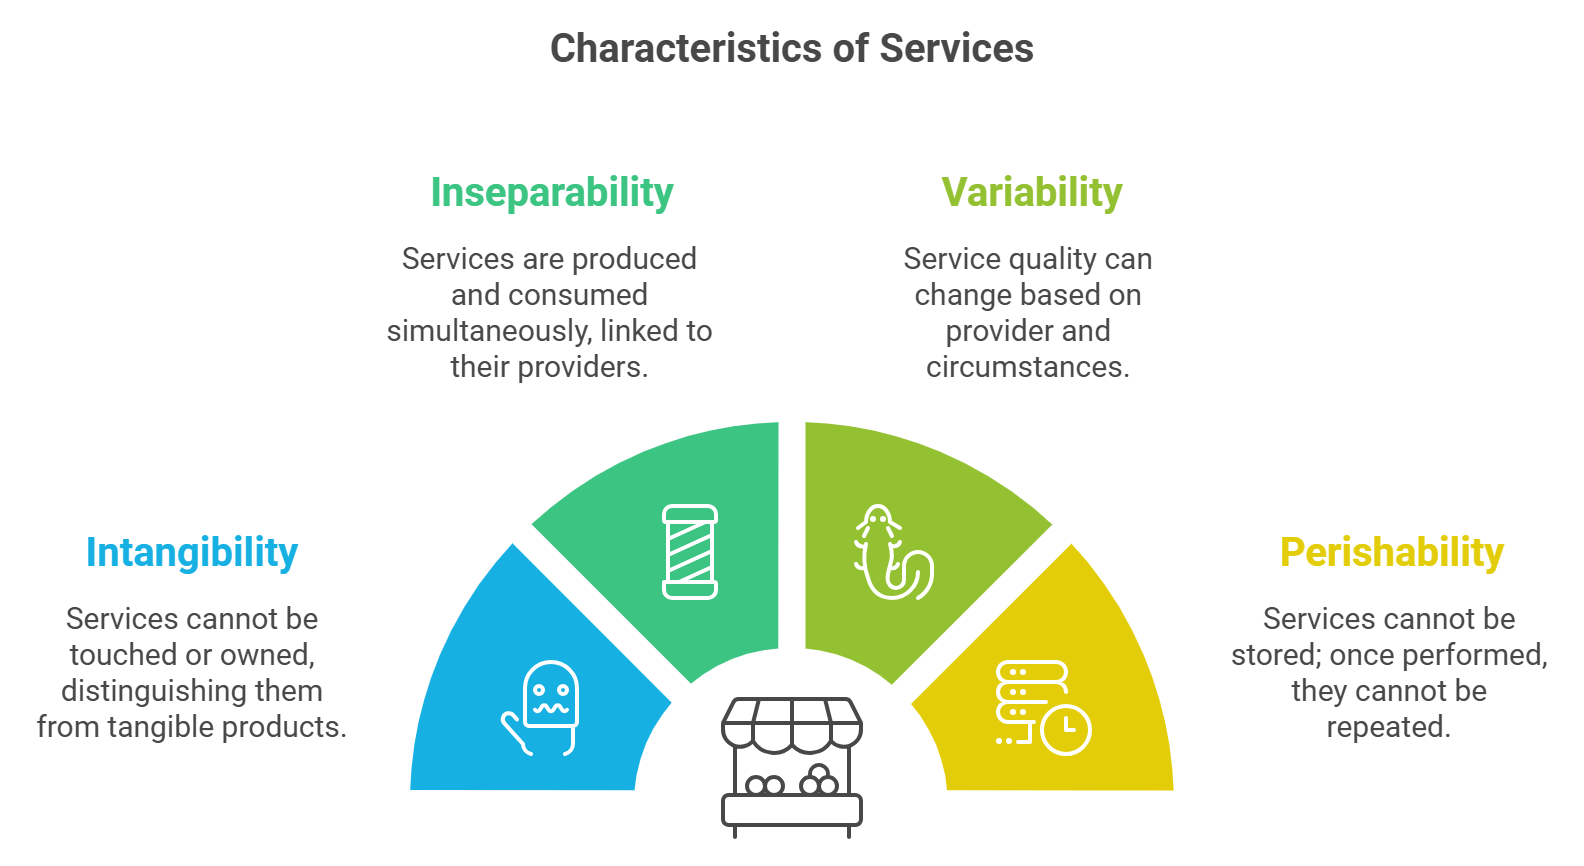
Services marketing differs from product marketing due to the intangible nature of services, inseparability of production and consumption, perishability, and variability.
- Intangibility: Services are intangible, meaning they cannot be touched or owned. This distinguishes them from physical products, which are tangible items that can be seen and touched.
- Inseparability: Services are typically produced and consumed simultaneously, meaning they cannot be separated from their providers. For example, a haircut or a massage is both delivered and received at the same time.
- Variability: The quality of services can vary depending on who provides them, as well as when, where, and how they are provided. This variability can be a challenge for maintaining consistent service quality.
- Perishability: Services cannot be stored for later use or sale. Once a service is performed, it cannot be repeated in the same way, which can lead to challenges in managing supply and demand.
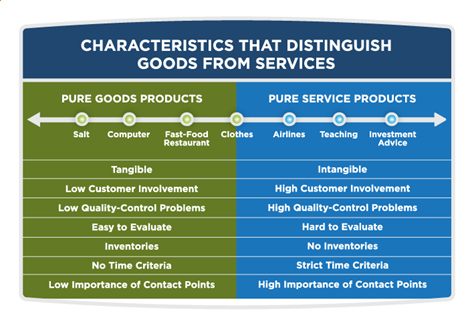
As illustrated in the figure below, the characteristics of service products vary in intensity from product to product, ranging from low for pure tangible goods to high for pure intangible services.
Important Role of Services
Services play an important role in modern economies, contributing significantly to economic growth, employment, and overall prosperity. This importance is particularly evident in developed countries, where the service sector often accounts for the largest share of economic activity.
Economic Contribution
The service sector encompasses a wide range of industries, including:
- Tourism and hospitality
- Financial services
- Healthcare
- Education
- Information technology
- Professional services (e.g., legal, consulting)
- Retail and wholesale trade
According to recent data, 79.55% of Canada’s workforce was employed in the service sector in 2022[3]. This figure demonstrates the significant role that services play in the Canadian economy and labour market.
Evolution of Economies From Commodities to Experiences
Economies have evolved from commodities to experiences causing a significant shift in how economic value is perceived and created. This progression is well-documented in the concept of the “experience economy,” introduced by B. Joseph Pine II and James H. Gilmore in the late 1990s[4]. Here is an overview of this evolution:
“The Progression of Economic Value” [3:43 min] by Strategic Horizons LLP[5]
If you are using a printed copy, you can scan the QR code with your digital device to go directly to the video: The progression of economic value

In summary, economic value progresses as follows:
- Commodities: At the most basic level, commodities are raw materials extracted from the earth, such as grains, minerals, and other natural resources. These are fungible and typically sold based on market prices, with little differentiation between sources.
- Goods: As economies industrialized, the focus shifted to manufacturing goods. These are tangible products created from commodities and sold to consumers. Goods offer more differentiation than commodities, as they can be branded and designed to meet specific consumer needs.
- Services: With further economic development, services became the primary focus. Services are intangible and involve activities performed for the benefit of consumers, such as banking, healthcare, and education. They offer greater customization and personal interaction compared to goods.
- Experiences: Pine and Gilmore argue that experiences are a distinct economic offering, different from services. Experiences are memorable events that engage consumers on an emotional, physical, intellectual, or even spiritual level. The value of experiences lies in their ability to create lasting memories and personal engagement, such as attending a concert or visiting a theme park.
Emergence of the Experience Economy
The transition to an experience economy reflects a broader cultural shift where consumers increasingly seek meaningful and memorable interactions rather than merely purchasing goods or services.
This shift has been driven by several factors:
- Consumer Preferences: As societies become more affluent, there is a growing desire for experiences over material possessions. Consumers are willing to spend more on activities that provide personal fulfillment and unique memories.
- Business Adaptation: Companies have adapted by designing and marketing experiences that cater to these evolving consumer preferences. This includes creating immersive environments and personalized interactions that enhance the overall consumer experience.
- Technological Advancements: Technology has enabled new forms of experiences, such as virtual reality and interactive digital platforms, which further enhance consumer engagement and satisfaction.
Experience Products
Experience products represent the evolution of services. As economies and consumer preferences have evolved, businesses have shifted their focus from merely delivering services to creating engaging and memorable experiences.

Experience products extend the characteristics of services by building upon the foundational elements of service offerings and enhancing them with additional layers of engagement, personalization, and emotional connection. Here are some examples to illustrate how experience products build upon the foundational elements of services.
Intangibility and Emotional Engagement: While services are intangible, experience products take this further by creating memorable interactions that evoke emotions.
Example: Attending a live concert or a theater performance involves not just the service of entertainment but an emotional journey that leaves a lasting impression.
Inseparability and Co-Creation: Experience products often involve the consumer as an active participant, enhancing the inseparability characteristic of services.
Example: Escape rooms or adventure tours require consumer participation to shape the outcome, making each experience unique and personalized.
Variability and Personalization: Experience products embrace variability by offering tailored interactions that cater to individual preferences.
Example: Personalized dining experiences at themed restaurants or customized travel itineraries offer unique value to each consumer, enhancing satisfaction and engagement.
Perishability and Memorability: Like services, experience products cannot be stored for future use. However, they focus on creating lasting memories and emotional connections.
Example: A visit to an immersive art installation or a virtual reality experience provides a unique, time-bound interaction that remains memorable long after the event.
Services Marketing Models
Several models have been developed over the years to address the unique characteristics and challenges of service products. Here is a closer look at some of these models.
The 8 Ps of Services Marketing
The unique characteristics and challenges of services have led to the expansion of the traditional 4Ps (product, price, place, promotion) by incorporating four additional Ps specific to services marketing: people, process, physical evidence, and performance[6].
- People: The people involved in delivering the service are crucial, as they directly impact the customer experience. This includes employees who provide the service and interact with customers, highlighting the importance of training and customer service skills.
- Process: The process refers to the procedures and flow of activities involved in delivering the service. Efficient and effective processes ensure a consistent service experience and can be a key differentiator in service quality.
- Physical Evidence: Since services are intangible, physical evidence provides tangible cues that help customers evaluate the service. This can include the physical environment where the service is delivered, branding, and any tangible items associated with the service. The importance of the physical environment on the service process has led to the development of the “Servicescape” concept (see the box below).
- Performance: This involves measuring and evaluating the effectiveness of marketing strategies and service delivery. Performance metrics can include customer satisfaction, service quality, and return on investment, helping businesses refine their approach and improve service delivery.
The “Servicescape”
Servicescape is a model developed by Mary Jo Bitner[7] to emphasize the impact of the physical environment on the service process. It aims to explain how the physical surroundings influence customer and employee behaviors during service interactions.
The Servicescape is composed of several elements that contribute to the overall service experience:
- Ambient Conditions: These include background characteristics such as temperature, lighting, noise, music, and scent. These factors can significantly influence the mood and comfort level of customers and employees.
- Spatial Layout and Functionality: This involves the arrangement of furnishings, equipment, and spaces, which affects the ease with which customers and employees can move and interact within the environment. A well-designed layout can facilitate efficient service delivery and enhance customer satisfaction.
- Signs, Symbols, and Artifacts: These elements include signage, decor, and personal artifacts that communicate information and create a certain atmosphere. They help customers navigate the space and understand the service process.

Lovelock’s Categories of Services
Christopher Lovelock[8] developed a classification framework for services based on two key dimensions:
- The Nature of the Service Act: Tangible and intangible actions.
- The Direct Recipient of the Service: People and things.
Based on these dimensions, Lovelock identified four broad categories of services:
- People Processing: Tangible actions directed at people’s bodies.
- Examples: Healthcare, passenger transportation, restaurants, and hair salons.
- Possession Processing: Tangible actions directed at goods and other physical possessions.
- Examples: Freight transportation, repair and maintenance, laundry services, and pet care.
- Mental Stimulus Processing: Intangible actions directed at people’s minds.
- Examples: Education, broadcasting, information services, and theatres.
- Information Processing: Intangible actions directed at intangible assets.
- Examples: Banking, legal services, accounting, insurance, and research)
This classification helps understand the nature of different services and their key characteristics. It provides insights into how services can be designed, delivered and marketed based on whether they involve tangible or intangible actions and whether they are directed at people or things.
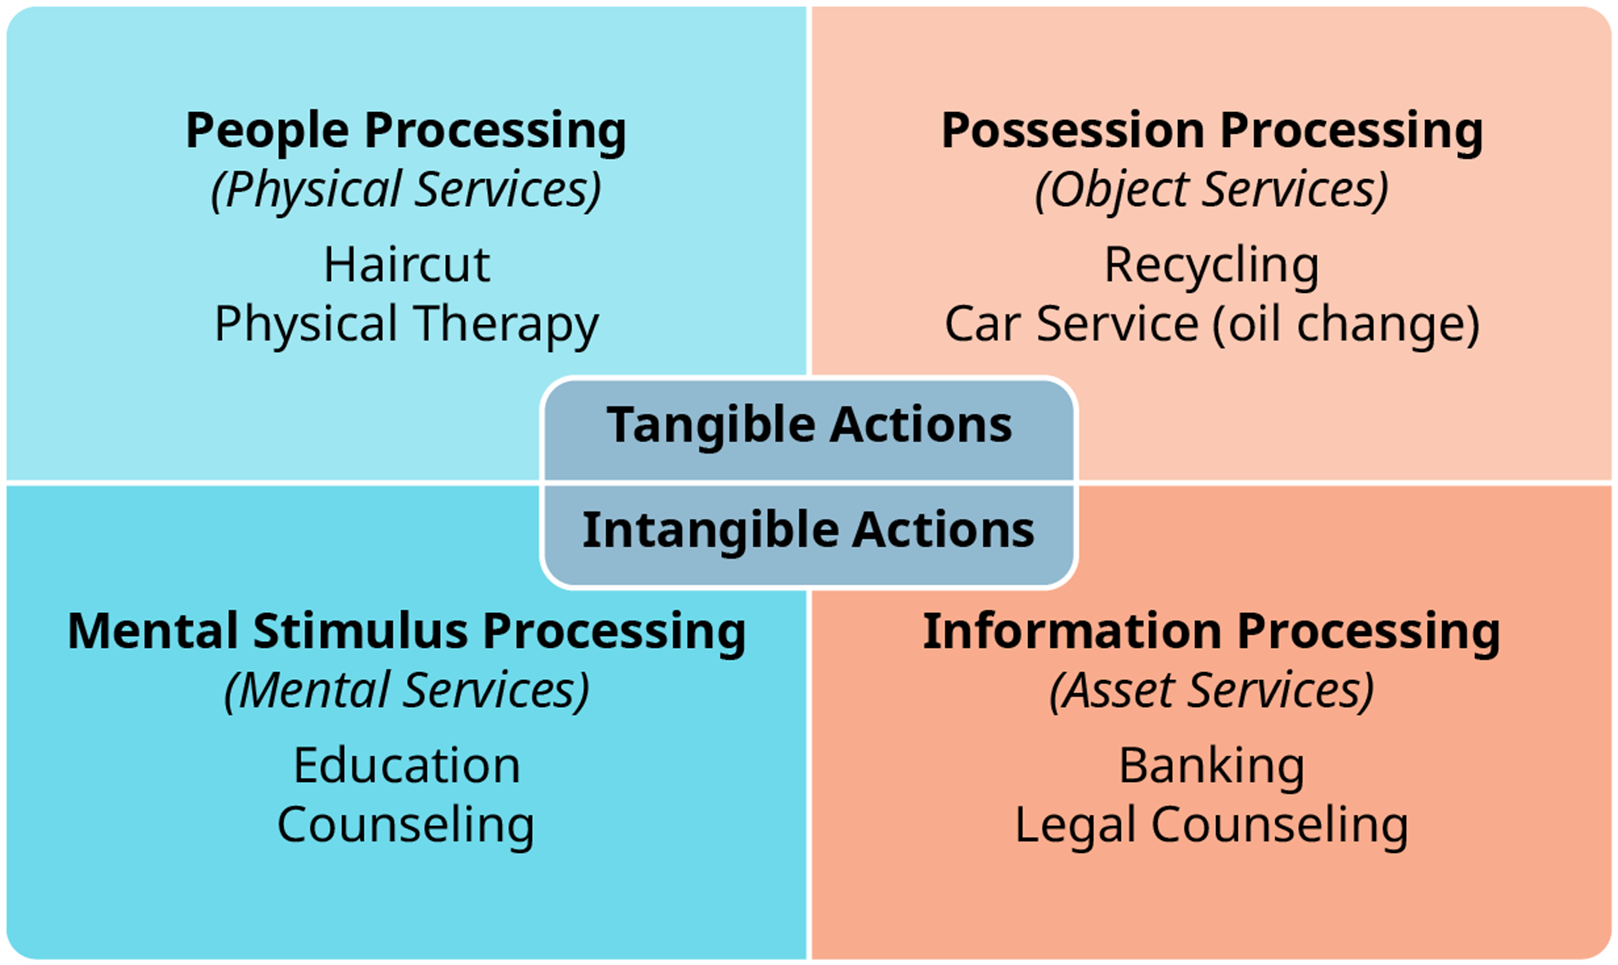
The framework is useful for service managers to analyze their offerings, identify similarities with other service industries, and develop appropriate strategies for service design, delivery, and customer interactions.
Services Marketing Triangle
The services marketing triangle is a strategic framework developed to illustrate the relationships between key actors involved in delivering a service. The key authors associated with this framework are Christopher Lovelock and Jochen Wirtz[9].
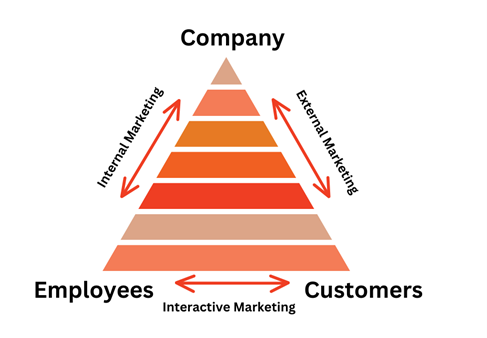
Key Components:
- The company (or service provider)
- Employees
- Customers
Types of Marketing in the Triangle:
- External Marketing: Between the company and customers.
- Internal Marketing: Between the company and employees.
- Interactive Marketing: Between employees and customers.
Main Concepts:
- The triangle emphasizes the importance of people in service delivery and marketing.
- It is based on the idea that service businesses revolve around making and keeping promises to customers.
- Each side of the triangle represents a different type of marketing activity crucial for service success.
Functions:
- External Marketing: Making promises to customers through advertising, pricing, etc.
- Internal Marketing: Enabling employees to deliver on promises through training, motivation, etc.
- Interactive Marketing: Delivering on promises during service encounters between employees and customers.
Service Profit Chain
The service profit chain[10] is another model developed to link employee satisfaction with increased profits. This model establishes relationships between profitability, customer loyalty, and employee satisfaction in service organizations. Developed by researchers at Harvard University, this model provides insights into how service companies can drive growth and profitability.
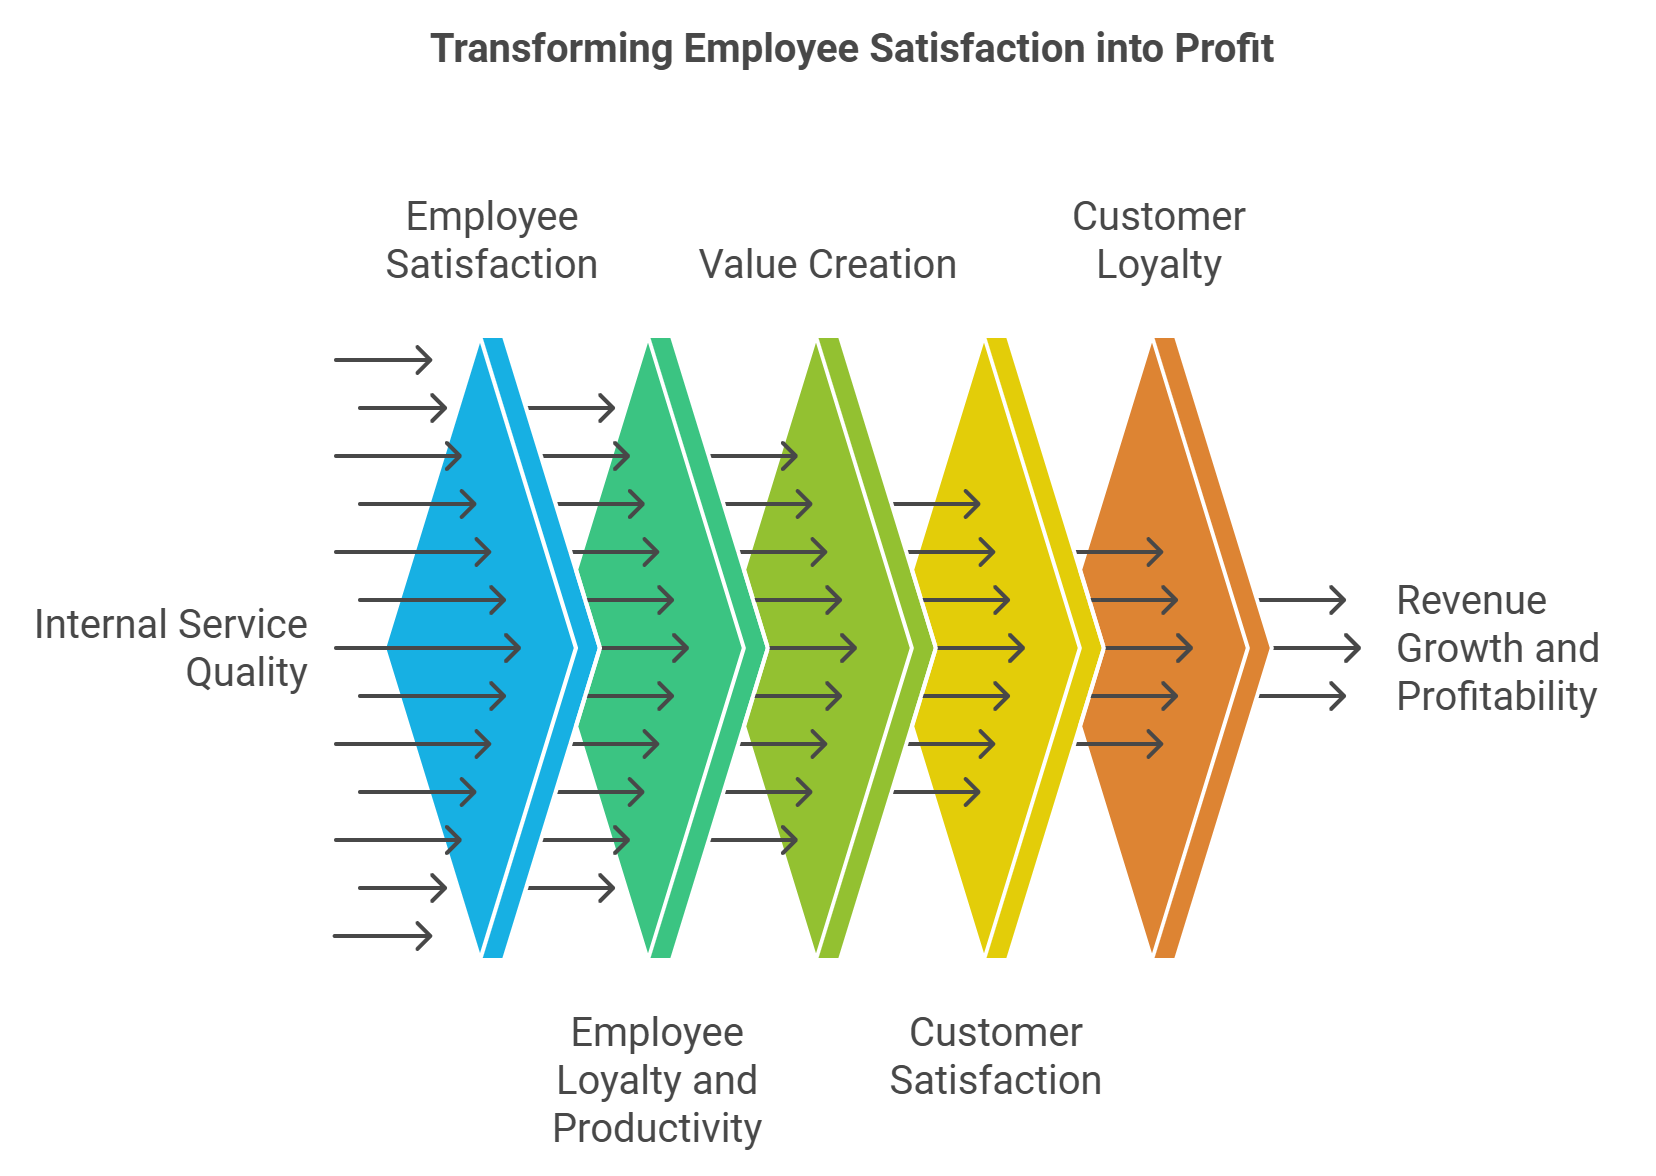
Key Components:
- Internal Service Quality: This refers to the support and resources provided to frontline employees by the organization. It includes factors like workplace design, job design, employee selection and development, employee rewards and recognition, and tools for serving customers.
- Employee Satisfaction: When internal service quality is high, it leads to employee satisfaction. Satisfied employees are more likely to be engaged and committed to their work.
- Employee Loyalty and Productivity: Satisfied employees tend to be more loyal to the organization and more productive in their roles. This increased loyalty and productivity create value for customers.
- Value Creation: Loyal and productive employees are better equipped to deliver high-quality services that create value for customers.
- Customer Satisfaction: When customers receive valuable services, they are more likely to be satisfied with their experience.
- Customer Loyalty: Satisfied customers often become loyal customers, leading to repeat business and positive word-of-mouth recommendations.
- Revenue Growth and Profitability: Customer loyalty ultimately drives revenue growth and profitability for the organization
Remember: profit is not the goal; it is the result.
Summary:
- Happy employees result in happy customers.
- Happy customers mean repeat business and spreading the word about your organization.
- Repeat (and new) business means profit and growth for the organization.
Gap Model of Service Quality
The gap model of service quality[11] is a framework that helps identify and analyze gaps between customer expectations and the actual service delivered by an organization. This model was developed by Parasuraman, Zeithaml, and Berry in the 1980s.
It consists of five key gaps:
- Knowledge Gap (Gap 1): This is the difference between customer expectations and management’s perceptions of those expectations. It occurs when companies do not accurately understand what customers want or need.
- Policy Gap (Gap 2): Also known as the standards gap, this represents the difference between management’s understanding of customer expectations and the translation of that understanding into service quality specifications and standards.
- Delivery Gap (Gap 3): This gap arises between the established service quality specifications and the actual service delivered. It often results from issues in implementation, such as inadequate resources or poor training.
- Communication Gap (Gap 4): This represents the difference between the service delivered and what is communicated to customers about the service. It often occurs when companies overpromise or fail to inform customers about behind-the-scenes efforts.
- Customer Gap (Gap 5): This is the overall gap between customer expectations and perceptions of the service actually received. It is essentially the sum of the other four gaps
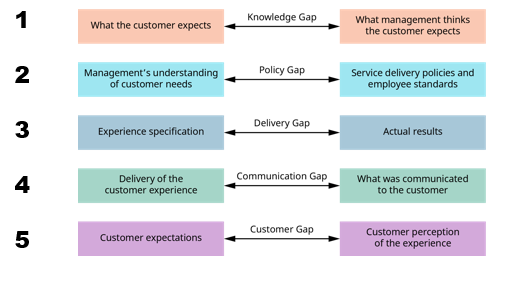
The gap model provides a structured approach to identifying sources of service quality issues. It helps organizations understand the complex nature of service delivery and customer satisfaction. It guides companies in developing strategies to close these gaps and improve overall service quality.
The RATER Framework of Service Quality
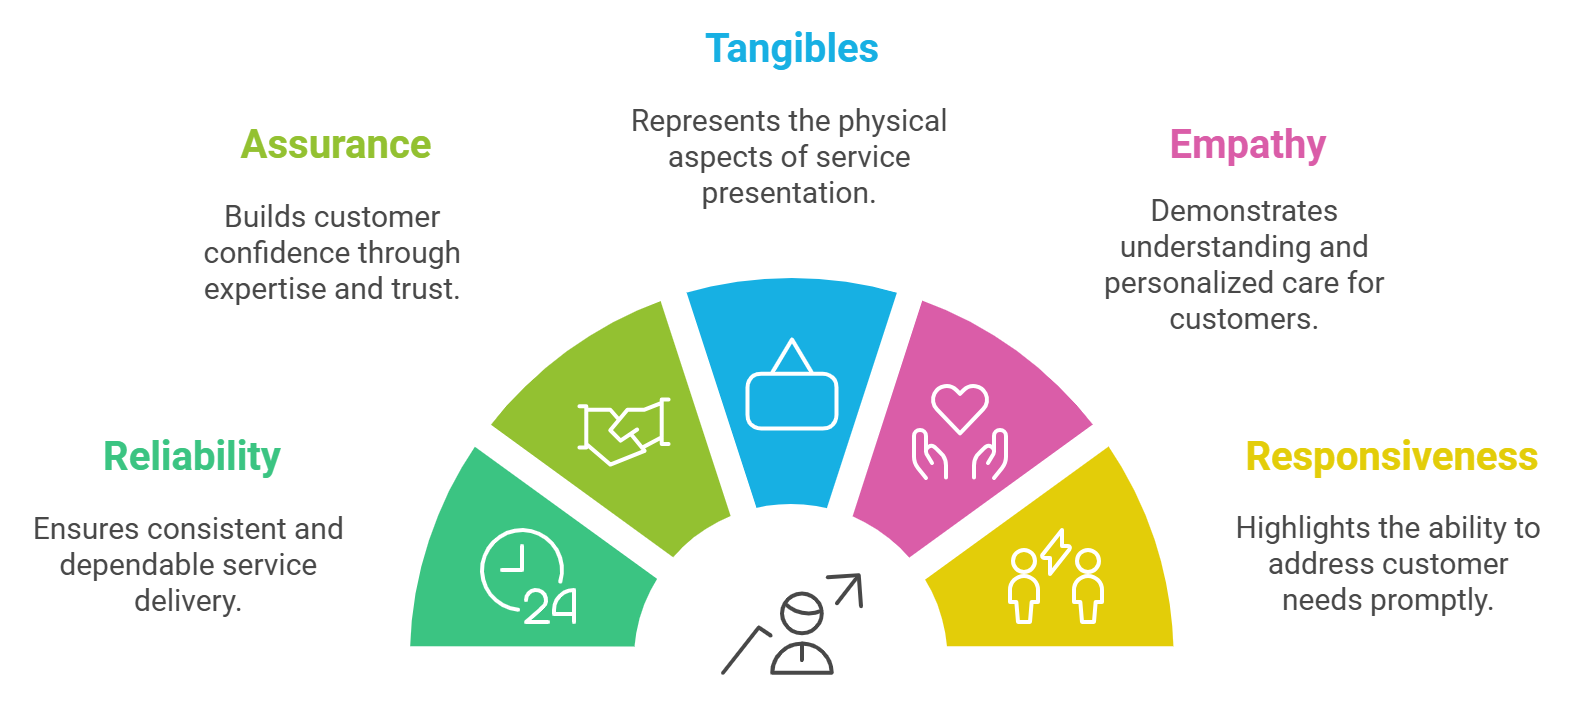
The RATER framework of service quality, developed by Zeithaml, Parasuraman, and Berry[12], is a refined version of their earlier SERVQUAL model for measuring service quality.
This framework focuses on five key dimensions that customers generally consider important when evaluating service quality:
- R — Reliability: The organization’s capability to provide accurate, dependable, and on-time service.
- A — Assurance: The degree to which the organization inspires trust in its customers.
- T — Tangibles: Factors such as the physical appearance of both the physical facility and employees.
- E — Empathy: Focusing on customers attentively to ensure that they receive caring and distinguished service.
- R — Responsiveness: A service staff’s desire to treat customers with respect and provide satisfactory and quick service, with an emphasis on promptness and willingness.
Example
Great Hospitality
“The Secret Ingredients of Great Hospitality | Will Guidara | TED” [13:53 min] by TED[13]
If you are using a printed copy, you can scan the QR code with your digital device to go directly to the video: The Secret Ingredients of Great Hospitality | Will Guidara | TED

Media Attributions
- Figure 1: “Characteristics of services” [created using Napkin.ai] by the author is under a CC BY-NC-SA 4.0 license.
- Figure 2: “Characteristics that distinguish goods from services” by Lumen Learning, via Principles of Marketing is used under a CC BY 4.0 license.
- Figure 3: “Silhouette of Dancing People Inside Club” by Wendy Wei (2018), via Pexels, is used under the Pexels license.
- Figure 4: “Vieux-Port de Montreal 54” by Jeangagnon (2019), via Wikimedia Commons, is used under a CC BY-SA 4.0 license.
- Figure 5: “Figure 11.6 Lovelock’s Categories of Service” by Rice University and OpenStax (2023), via Principles of Marketing, is used under a CC BY 4.0 license.
- Figure 6: “Service marketing triangle” [created using Canva] by the author is under the Canva content license.
- Figure 7: “The service profit chain” [created using Napkin.ai] by the author is under a CC BY-NC-SA 4.0 license.
- Figure 8: “Figure 11.11 Gap Model of Service Quality” by Rice University and OpenStax (2023), via Principles of Marketing, is used under a CC BY 4.0 license.
- Figure 9: “The RATER framework of service quality” [created using Napkin.ai] by the author is under a CC BY-NC-SA 4.0 license.
- Fitzsimmons, J. A., & Fitzsimmons, M. J. (2004). Service management: Operations, strategy, information technology (4th ed.). McGraw-Hill. ↵
- Zeithaml, V. A., & Bitner, M. J. (1996). Services marketing. McGraw-Hill. ↵
- O'Neill, A. (2024). Distribution of the workforce across economic sectors in Canada 2022. Statista. https://www.statista.com/statistics/271244/distribution-of-the-workforce-across-economic-sectors-in-canada/ ↵
- Pine, B J., II., & Gilmore, JH (1998). Welcome to the experience economy. Harvard Business Review, 76(4), 97–105. ↵
- Strategic Horizons LLP. (2011, April 29). The progression of economic value [Video]. YouTube. https://youtu.be/9TqHluioAAI?si=R3f5GqKblsufwK0r ↵
- Zeithaml, V. A., Bitner, M. J., & Gremler, D. D. (2018). Services marketing: Integrating customer focus across the firm (7th ed.). McGraw-Hill Education. ↵
- Bitner, M. J. (1992). Servicescapes: The impact of physical surroundings on customers and employees. Journal of Marketing, 56(2), 57–71. https://doi.org/10.1177/002224299205600205 ↵
- Lovelock, C. H. (1983). Classifying services to gain strategic marketing insights. Journal of Marketing, 47(3), 9–20. https://doi.org/10.1177/002224298304700303 ↵
- Wirtz, J., & Lovelock, C. (2021). Services marketing: People, technology, strategy (9th ed.). World Scientific Publishing. ↵
- Heskett, J. L., Jones, T. O., Loveman, G. W., Sasser, W. E., & Schlesinger, L. A. (1994). Putting the service-profit chain to work. Harvard Business Review, 72(2), 164-174. ↵
- Parasuraman, A., Zeithaml, V. A., & Berry, L. L. (1985). A conceptual model of service quality and its implications for future research. Journal of Marketing, 49(4), 41–50. https://doi.org/10.1177/002224298504900403 ↵
- Zeithaml, V. A., Parasuraman, A., & Berry, L. L. (1990). Delivering quality service: Balancing customer perceptions and expectations. The Free Press. ↵
- TED. (2022, October 31). The secret ingredients of great hospitality | Will Guidara | TED [Video]. YouTube. https://youtu.be/bwcyXcOpWVs?si=u89rPdDQtTsQO4Hs ↵
A characteristic of services where they cannot be seen, touched, or physically experienced before purchase.
A characteristic of services where production and consumption occur simultaneously.
A characteristic of services where quality can vary depending on who provides them, when, and where.
A characteristic of services where they cannot be stored for later use.
A framework showing the relationships between company, employees, and customers in service delivery.
A model linking employee satisfaction to customer satisfaction and ultimately to profitability.
A framework that identifies gaps between customer expectations and perceptions of service quality.
A tool for measuring service quality through Reliability, Assurance, Tangibles, Empathy, and Responsiveness.

